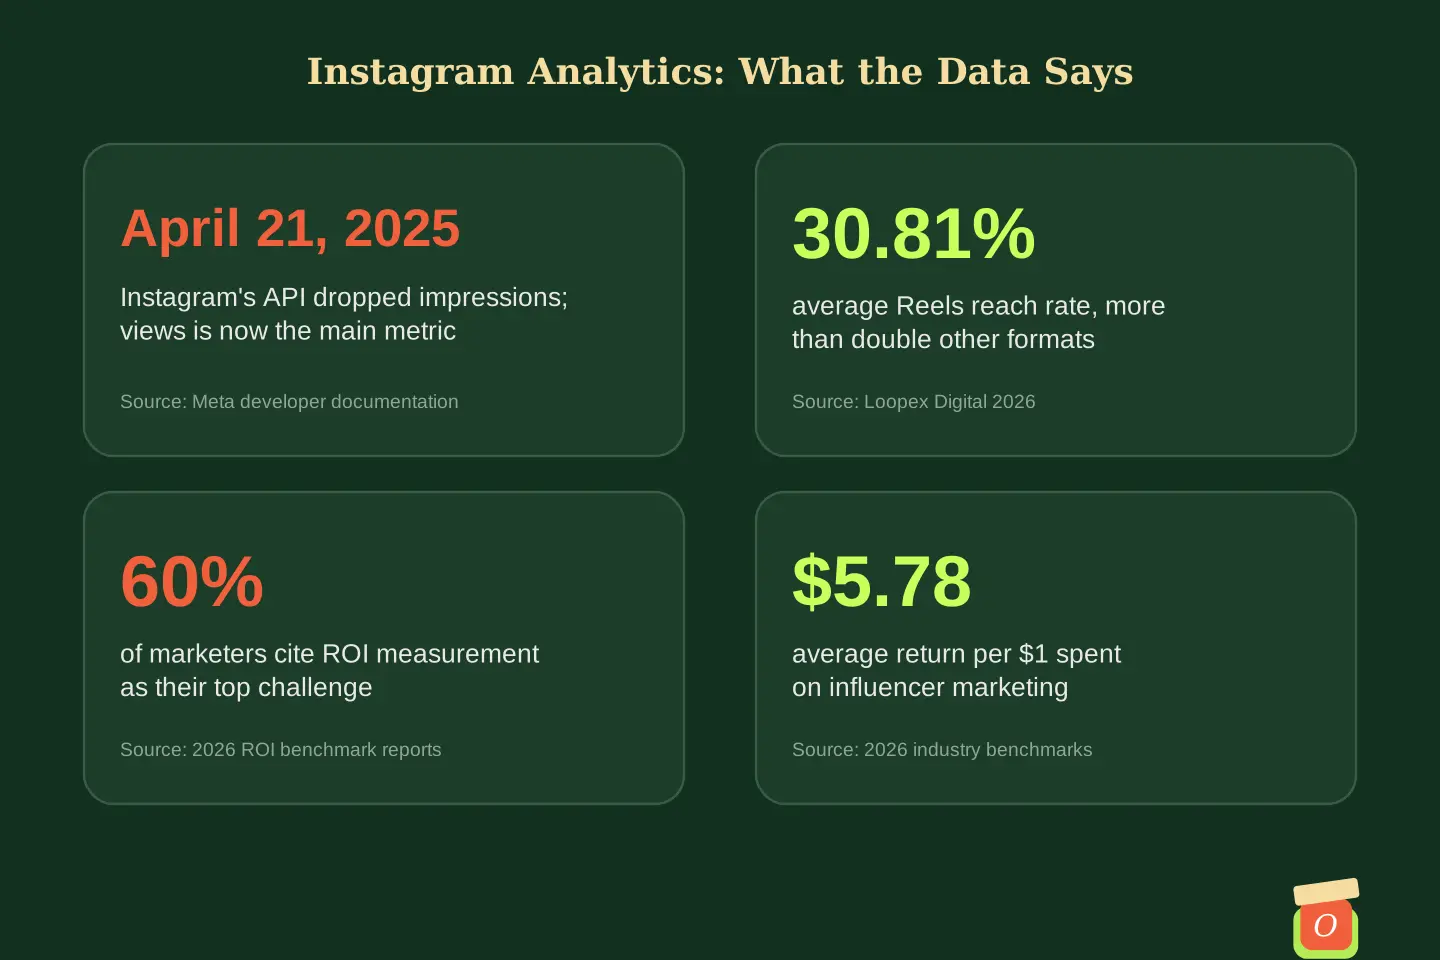
Instagram changed its main metric. Since April 21, 2025, Instagram’s API no longer returns “impressions” for any version, and “views” has taken its place as the headline number across Reels, posts, and Stories. If your campaign reports still list impressions, or still rely on screenshots a creator sent after the fact, you are measuring with an outdated ruler. The same shift is a reminder that what you measure decides what you improve.
This guide explains how Instagram analytics improve campaigns, from the metrics that matter for Reels and Stories to the audience data that tells you whether a creator truly fits your brand. You will also see how to turn numbers into decisions while a campaign is still running, and how Brand-O-fluence brings verified Instagram data into one workflow. If you are new to the basics, start with our guide on why influencer analytics matter.
Table of Contents
- How Instagram Analytics Improve Campaigns: The Core Idea
- The Instagram Metrics That Matter
- Reels Analytics: Watch Time, Shares, and Saves
- Stories Analytics: Taps, Exits, and Replies
- Audience Insights and Brand Fit
- How Instagram Analytics Improve Campaigns in Practice
- How Brand-O-fluence Turns Instagram Data Into Decisions
- Step-by-Step: Build an Instagram Analytics Routine
- Frequently Asked Questions About How Instagram Analytics Improve Campaigns
How Instagram Analytics Improve Campaigns: The Core Idea
Analytics improve a campaign when they change a decision. A number that only appears in a final report may be interesting, but it cannot help you spend the next rupee better.
From Reporting to a Loop
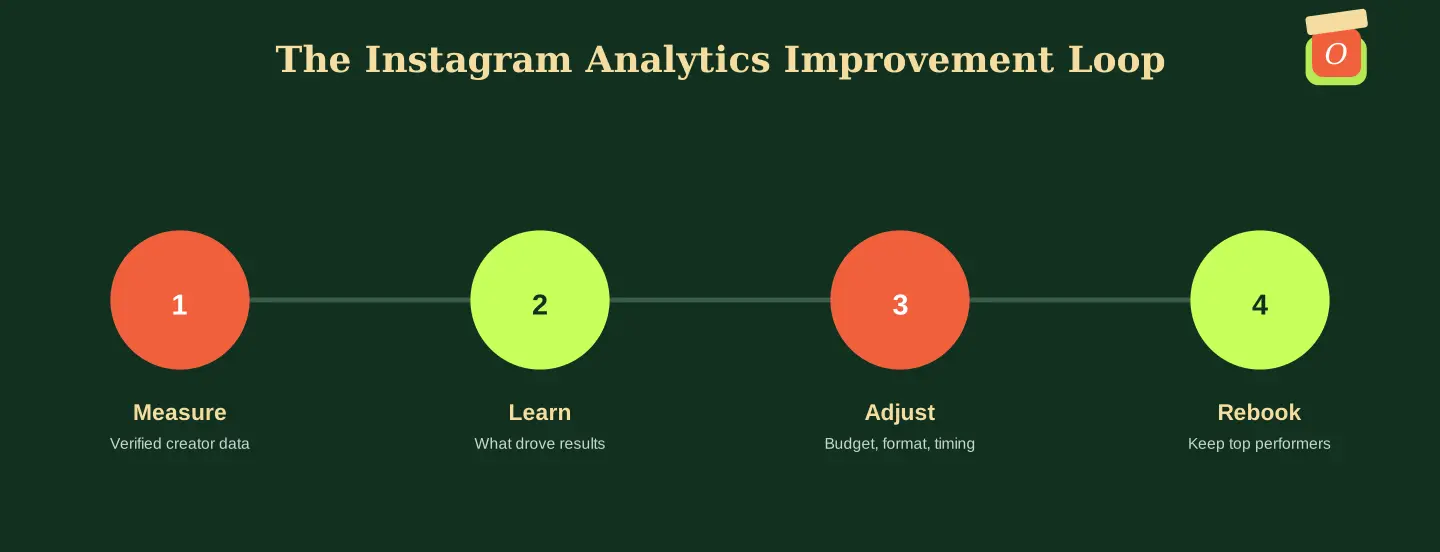
The most useful way to think about Instagram data is as a loop: measure what happened, learn why, adjust the plan, and rebook the creators who worked. Each pass makes the next campaign cheaper to run and easier to predict. Brands that only report at the end skip the adjust step, which is where most of the value sits. Over a year of campaigns, even small improvements in format choice, creator selection, and timing add up to a large difference in cost per order.
Why Measurement Is Still the Hard Part
Around 60 percent of marketers cite ROI measurement as their biggest influencer marketing challenge, even though 89 percent say campaigns deliver measurable returns. The gap exists because data is scattered across screenshots, spreadsheets, and platform screens. Bringing it into one verified view removes most of that friction, and it also makes it far easier to explain results to a founder, a finance team, or a client who wants to know where the money went.
What Changed in Instagram’s Metrics
Instagram began replacing impressions and plays with views in 2024, and its API removed impressions entirely on April 21, 2025. Views now count how often content was seen, while reach counts unique accounts. Reports built on older terms can mislead, so check what each number means before you compare creators or campaigns.
The Instagram Metrics That Matter
Instagram offers dozens of numbers, but a handful do most of the work. Start with these and add more only when a question requires them.
Reach and Views
Reach is the number of unique accounts that saw your content, and Meta labels it as an estimate. Views count total plays or displays, including repeat views by the same person. A large gap between views and reach suggests people are rewatching, which is often a good sign for Reels but a warning for a Story people keep tapping back through to read.
Engagement, Saves, and Shares
Engagement combines likes, comments, saves, shares, and replies. Saves and shares usually say more about intent than likes do, because people save what they plan to use and share what they want others to see. One benchmark source argues that a Reel with a modest engagement rate but a high save rate can outperform a post with higher engagement and few saves, since saves help content spread beyond the creator’s followers.
Engagement Rate: Know Your Formula
Engagement rate can be calculated against followers or against reach, and the two give very different numbers. Rate against followers is easy to compare across creators, while rate against reach shows how well content performed with the people who actually saw it. Pick one method, apply it to every creator, and write it into your report so comparisons stay fair. Mixing the two methods in the same table is one of the most common reasons brands think one creator beat another when the difference was only the formula.
Reels Analytics: Watch Time, Shares, and Saves
Reels are the main discovery format, so they deserve their own scorecard. The questions to answer are whether people watched, whether they cared, and whether they passed it on.
Views and Reach
One 2026 compilation puts the average Reels reach rate near 30.8 percent, more than double other formats. That makes Reels the best way to put a product in front of people who do not follow the creator. Compare each creator’s Reel views to their follower count to see whether they reliably reach beyond their own audience.
Average Watch Time
Instagram’s API reports both total and average watch time for Reels. A Reel with strong views but a very short average watch time means viewers left quickly, usually because the opening failed or the product appeared too late. Share this with the creator and test a stronger first three seconds on the next piece.
Shares and Saves
Shares show what people found worth passing along, and saves show what they want to return to. A Reel that gathers many shares is often doing the brand’s reach work for free. Track both, and note which messages, hooks, and formats earned them. Over a few campaigns, these notes become a playbook of openings and angles that reliably work for your category.
Stories Analytics: Taps, Exits, and Replies
Stories behave differently from feed content, and the data shows it. They are short-lived, so you need a plan to capture the numbers in time.
Navigation: Forward, Back, and Exits
Instagram reports Story navigation as taps forward, taps back, next-story swipes, and exits. High exits on a particular frame show where attention dropped, while taps back suggest viewers wanted another look. These signals help you decide whether a Story sequence is too long or buries the key point. If most viewers exit on the third frame, move the offer to the first or second frame next time.
Replies and Link Taps
Replies show real conversation, and link taps show intent to act. For offer-driven campaigns, link taps and unique code usage are the clearest Story metrics. Give every creator a tracked link or code so these actions connect to orders.
Capture the Data Before It Expires
Stories disappear after 24 hours, and Meta’s documentation recommends capturing Story insights before they expire. Insights may also be unavailable when too few people viewed the content. For brands, this is a strong reason to use a platform that collects Story data automatically instead of asking creators for screenshots later.
Audience Insights and Brand Fit
Performance numbers tell you what happened. Audience data tells you who it happened to, which is what decides whether the result can turn into sales.
Age and Gender
Check whether the creator’s followers match your buyer. A premium skincare brand aimed at women aged 25 to 34 gains little from a creator whose audience skews far younger or far older, however strong the engagement looks.
Top Cities and Locations
City data shows where the audience actually lives, which matters for local delivery, store visits, and regional language. A Pune-based creator may have most of their audience in another state, and only verified location data will show it. This is one of the quickest ways to avoid paying for reach in cities you cannot serve.
Scoring Fit Across Creators
Combine audience match, engagement quality, content style, and past brand work into a simple score for each creator, as described in our guide on how to choose the perfect influencer for your brand. Review it again after the campaign, since real results often reveal fit that a profile could not. A creator who looked average on paper may turn out to be the strongest partner you have.
How Instagram Analytics Improve Campaigns in Practice
Here is where numbers turn into actions. These three habits create most of the improvement.
Reallocate Budget Mid-Campaign
Review results at the halfway point and move remaining budget toward creators who are outperforming on reach, saves, and tracked orders. This is only possible when data arrives while the campaign is still live, which is why waiting for a final report wastes the chance.
Match Format and Creative to Results
If carousels earn more saves and Reels earn more reach, assign each format a clear job. Socialinsider’s 2026 benchmarks show carousels averaging about 0.55 percent engagement on brand posts against 0.50 to 0.52 percent for Reels, so a mix of both often works best. Use your own campaign data to refine that mix, since your category, audience, and creators may behave differently from the averages.
Amplify the Best Posts
Instagram lets brands put paid reach behind a creator’s post as a partnership ad. Pick the posts with the strongest saves, shares, and watch time, then amplify those instead of boosting content at random, since paid reach works best behind content that already earned attention organically. Our guide on the Instagram influencer marketing guide covers how this fits into a full campaign.
How Brand-O-fluence Turns Instagram Data Into Decisions
Brand-O-fluence is built so that brands see verified Instagram numbers in the same place they run the campaign.
Verified Data From Instagram’s API
Reach, views, engagement, and Story performance come through Instagram’s Graph API when a creator connects their professional account, instead of arriving as screenshots. Audience age, gender, and top cities appear alongside them. This follows the same standard described in our guide on how to analyze Instagram influencers.
Results by Creator, Not Just by Campaign
Seeing performance for each creator makes rehire decisions simple. You can spot which partners drove saves, which drove tracked orders, and which underdelivered. That record also gives you a fair, evidence-based way to negotiate rates with creators you want to keep.
Connected to Briefs and Payments
Analytics sit next to briefs, content review, and escrow-protected payment, following the stages in our guide on how to run an influencer campaign. That connection lets you act on what you see before the campaign ends.
Consider a Lucknow-based ethnic wear label running a festive campaign with nine Instagram creators. At the halfway point, the dashboard showed that three creators’ Reels had strong reach but short average watch time, while two creators’ carousels were earning far more saves and tracked orders than the rest. The brand shifted the remaining budget toward the carousel creators, asked the Reel creators to reshoot the opening seconds, and amplified the two best-saved posts as partnership ads. It finished the campaign with more tracked orders than its previous launch and kept the five best performers for the next one.
Step-by-Step: Build an Instagram Analytics Routine
Use this routine on your next campaign. It takes little time once it becomes a habit.
- Choose three goal metrics: For example reach for awareness, saves for interest, and tracked orders for sales.
- Define your engagement formula: Decide whether you measure against followers or reach, and apply it to every creator.
- Set baselines before launch: Record each creator’s typical reach, views, and engagement from recent posts.
- Give every creator a tracked code or link: This connects content to orders.
- Capture Story data quickly: Collect it within the 24-hour window, or use a platform that does it automatically.
- Review at the midpoint: Shift budget toward the creators and formats that are working.
- Compare and rebook: Review results by creator, record what you learned, and carry it into the next brief.
Instagram Metrics at a Glance
The table below shows what each metric tells you and what to watch for.
| Metric | What It Tells You | How to Use It | Watch Out For |
|---|---|---|---|
| Reach | Unique accounts that saw the content | Judge awareness and compare creators | It is an estimate |
| Views | Total plays or displays, including repeats | Replaces impressions in reports | Does not show who saw it |
| Saves | Content people want to return to | Spot strong purchase intent | Not available for Stories |
| Shares | Content worth passing on | Find messages that spread | Can be lower for private categories |
| Average Watch Time | How long people stayed on a Reel | Fix weak openings and long intros | Only for Reels |
| Story Navigation | Taps forward, back, and exits | Trim Story sequences | Expires quickly if not captured |
| Audience Demographics | Age, gender, and city of followers | Check brand fit before and after | Needs verified, current data |
Frequently Asked Questions About How Instagram Analytics Improve Campaigns
What happened to Instagram impressions?
Instagram began replacing impressions and plays with views in 2024, and its API removed impressions for all versions on April 21, 2025. Views is now the main metric, while reach counts unique accounts. Update any reports that still list impressions.
Which Instagram metrics matter most for influencer campaigns?
Reach, views, saves, shares, engagement rate, and audience demographics cover most needs. For Reels add average watch time, and for Stories add navigation and link taps. Match the metric to your goal, such as reach for awareness or tracked orders for sales.
How do I calculate Instagram engagement rate?
Add likes, comments, saves, and shares, then divide by either followers or reach and multiply by 100. Followers makes comparison across creators easy, while reach shows performance with people who saw the content. Use one method consistently for every creator.
Why are Instagram Stories data hard to collect?
Stories expire after 24 hours, and Meta recommends capturing insights before they disappear. Insights may also be unavailable when too few people viewed the content. Automated collection avoids the need to chase creators for screenshots.
How often should I review Instagram analytics during a campaign?
Check at least at the midpoint, plus a final review when the campaign ends. Short campaigns benefit from a quick check every few days. The goal is to act on the data while you still have budget and time to change course, rather than discovering a problem after the last post has gone live.
How Instagram analytics improve campaigns comes down to using fresh, verified numbers to make better decisions while a campaign is still running. Reach and views show how far content traveled, saves and shares show what people valued, watch time and navigation show where attention dropped, and audience data shows whether the right people were watching. Brands that run this loop on every campaign get steadily better results, instead of starting from scratch each time, and they build a clear record of what works for their own audience.
If you want verified Instagram data in the same place you run your campaigns, explore Brand-O-fluence today. See reach, views, engagement, and audience insights for every creator, pay safely through escrow, and rebook the partners who perform. Whether you work with three creators or thirty, the same verified view applies every time. Start your next campaign on Brand-O-fluence and let the data guide your budget.
Leave a Reply