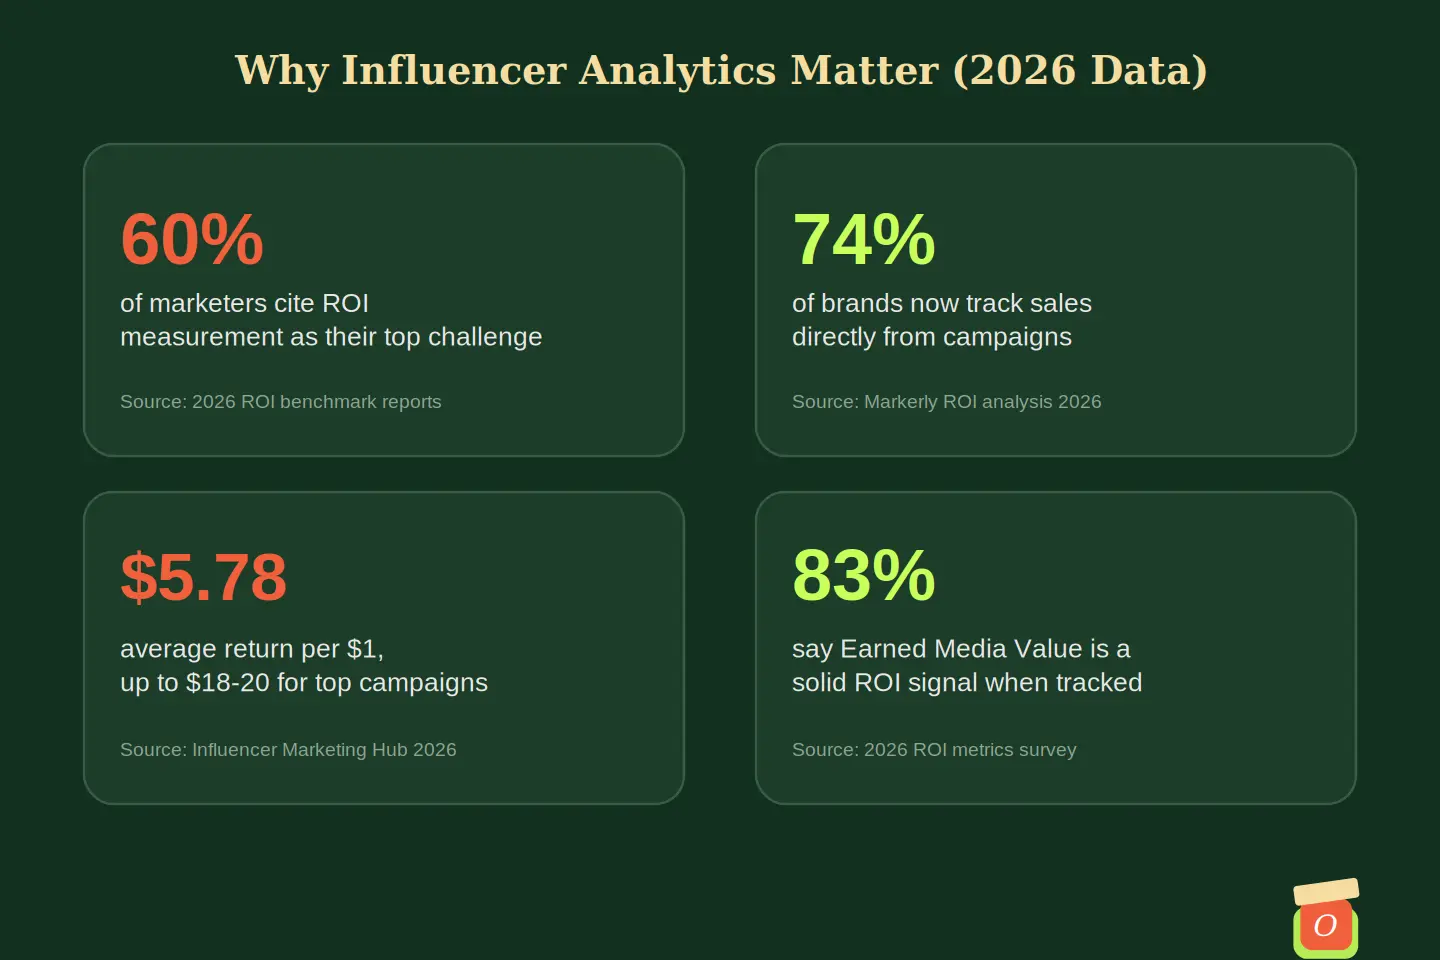
Up to 60 percent of marketers say measuring ROI is their single biggest challenge in influencer marketing, even in a channel that returns an average of $5.78 for every $1 spent. That gap between strong average returns and widespread measurement struggles is not a coincidence. Most brands are still judging campaigns on gut feeling, screenshots, and follower counts instead of the data that actually predicts performance.
Understanding why influencer analytics matter is the difference between a campaign you hope worked and a campaign you can prove worked. This guide breaks down the core metrics every brand should track, the audience data that matters more than most marketers realize, and how a verified platform like Brand-O-fluence turns raw numbers into decisions you can actually act on. By the end, you should have a clear framework for what to measure, when to check it, and how to act on what you find, instead of reviewing a pile of numbers only after a campaign has already ended. Before you get to analytics, though, you need the right creators in place, which is exactly what our guide on how to choose the perfect influencer for your brand walks through in detail.
Table of Contents
- Why Influencer Analytics Matter for Every Brand Campaign
- The Core Metrics Every Brand Should Track
- Why Audience Insights Matter More Than Follower Count
- How Influencer Analytics Improve Campaign ROI
- Common Analytics Mistakes Brands Make
- How Brand-O-fluence Delivers Verified Influencer Analytics
- Step-by-Step: Setting Up Analytics Tracking for Your Next Campaign
- Frequently Asked Questions About Why Influencer Analytics Matter
Why Influencer Analytics Matter for Every Brand Campaign
Influencer analytics are the metrics that show how a creator’s content actually performed, covering everything from raw visibility to genuine audience behavior. They matter because they replace guessing with evidence, at a point in the industry where finance teams increasingly expect creator partnerships to justify their budget the same way any other channel does. A campaign that cannot be measured cannot be improved, which is the core reason analytics have moved from a nice-to-have to a baseline requirement for serious creator marketing programs.
From Vanity Metrics to Real Performance Data
Follower counts and raw likes look impressive in a slide deck, but they say very little about whether a campaign actually moved the needle. The industry-wide shift toward performance metrics like conversion rate, cost per acquisition, and verified engagement reflects a broader move away from vanity numbers toward figures that connect directly to revenue.
Why Screenshots Are Not Analytics
A screenshot shared by a creator shows exactly what that creator wants you to see, at the exact moment they chose to capture it. Real analytics come from a consistent, verifiable source, whether that is a platform API or a dedicated measurement tool, so numbers can be checked and compared fairly across every creator in a campaign.
The Cost of Ignoring Analytics
Brands that skip analytics tend to repeat the same mistakes, paying premium rates to creators whose audience never truly matched the product, or missing early signs that a campaign needed adjusting mid-flight. Without data, every campaign decision reduces to a guess, no matter how experienced the marketing team behind it is.
The Core Metrics Every Brand Should Track
Not every metric deserves equal attention. These three form the foundation that almost every other analysis builds on, and they map closely to the awareness, engagement, and conversion stages most campaigns move through.
Reach and Impressions
Reach counts the unique accounts that saw a piece of content at least once, while impressions count every single display, even repeat views from the same person. Both metrics are useful for awareness campaigns, but neither one tells you whether anyone actually cared enough to act, which is why they should never be the only numbers in a report.
Engagement Rate
Engagement rate measures how many people interacted with a post relative to its reach, through likes, comments, saves, and shares. It remains one of the strongest available signals for how well content resonates with an audience, especially when compared against a creator’s own historical baseline rather than a generic industry average.
Story Performance
Stories behave differently from feed posts, with metrics like completion rate, tap-forward rate, and swipe-up or link clicks telling you how well content held attention frame by frame. A campaign that looks strong on feed engagement but weak on story completion often signals a mismatch between the creator’s usual content style and what the brand asked them to produce.
- Awareness metrics: Reach, impressions, and video views show how far content traveled.
- Engagement metrics: Likes, comments, saves, and shares show how strongly people responded.
- Conversion metrics: Click-through rate, promo code usage, and direct sales show actual business impact.
Why Audience Insights Matter More Than Follower Count
Knowing how many people follow a creator tells you almost nothing about who those people actually are. Audience insights fill that gap, and they are often the single most overlooked layer of influencer analytics, even though they frequently explain why two creators with similar engagement rates produce very different campaign results.
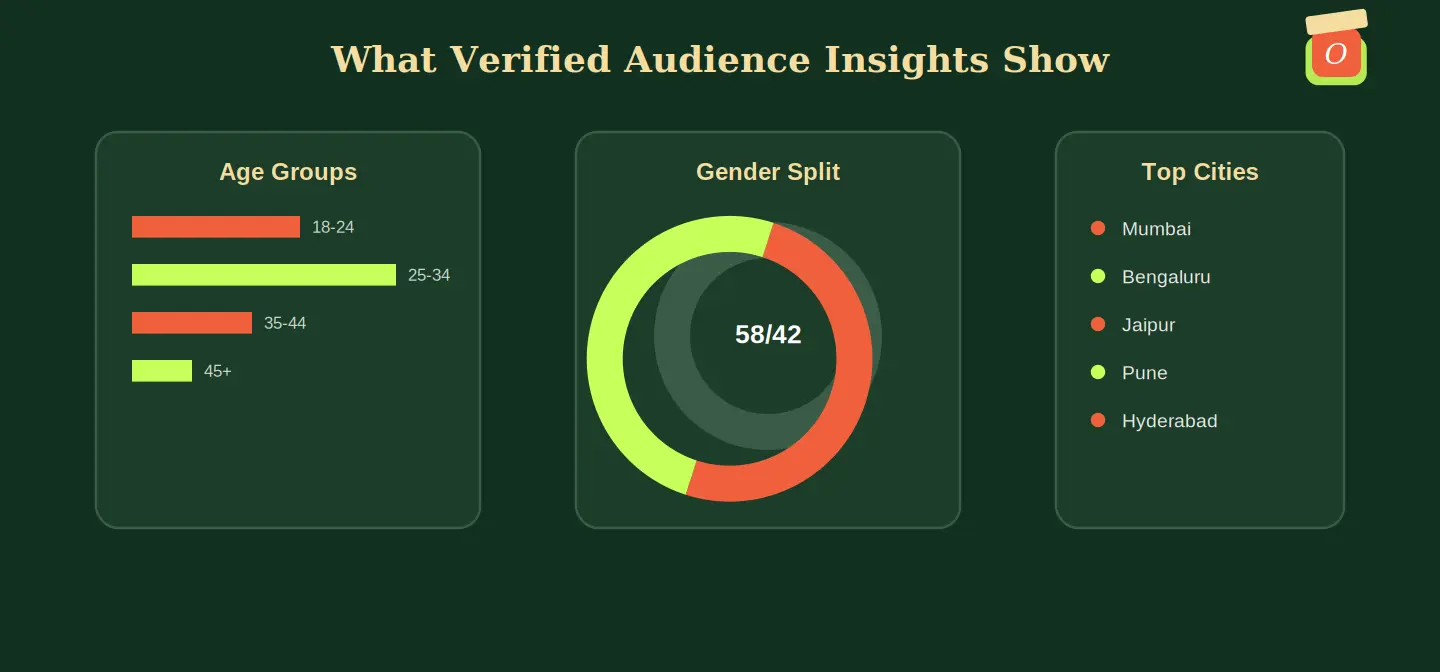
Age Groups and Gender Distribution
A skincare brand targeting women aged 25 to 34 gains little from a creator whose audience skews heavily toward teenagers or older demographics, regardless of how strong the engagement numbers look. Age and gender breakdowns confirm whether a creator’s community actually matches the buyer persona a campaign is built around.
Top Cities and Locations
Location data shows exactly where a creator’s audience is concentrated, which matters enormously for brands running region-specific promotions or physical retail tie-ins. A creator based in one city can still have most of their engaged audience somewhere else entirely, which only becomes visible through verified location data.
Audience Authenticity Signals
Authenticity signals include the ratio of real, active accounts to inactive or automated ones, along with natural variation in engagement across different posts. A perfectly flat engagement pattern across every single post is often a stronger warning sign than a low engagement number, since real audiences rarely behave with that kind of consistency.
How Influencer Analytics Improve Campaign ROI
Good analytics do more than explain what already happened. Used correctly, they change decisions before and during a campaign, which is where the real ROI improvement comes from.
Choosing Better Creators
Analytics turn creator selection from a guessing game into a comparison exercise, letting you weigh authenticity, engagement quality, and audience fit side by side across every candidate on your shortlist. Our guide on the benefits of influencer marketing for brands covers how this kind of data-backed selection process connects directly to stronger campaign returns.
Optimizing Budget Allocation
Mid-campaign analytics let you spot which creators are outperforming expectations and which are underdelivering, so budget for future phases can shift toward what is actually working. Brands that wait until a campaign fully wraps up before reviewing performance miss the chance to make these adjustments while they still matter.
Proving Results to Stakeholders
Clear, verified analytics give marketing teams a straightforward way to justify influencer spend to finance and leadership, especially as more organizations start treating creator partnerships like any other measurable investment. A report built on real reach, engagement, and conversion data holds up to scrutiny in a way that a folder of screenshots never will.
Common Analytics Mistakes Brands Make
Even brands that genuinely want to measure performance well fall into a few recurring traps that quietly undermine their own data. Recognizing these patterns is often enough to fix them, since most come from a process gap rather than a lack of available tools.
Relying on Self-Reported Screenshots
Screenshots can be cropped, timed selectively, or simply outdated by the time a brand reviews them, which makes them a weak foundation for any real comparison across creators. Verified, platform-sourced data removes this problem entirely by pulling the same numbers a creator would see in their own account.
Ignoring Engagement Composition
A high engagement rate built mostly on generic comments and repeated emoji tells a very different story than one built on genuine questions and product-specific feedback. Brands that only look at the headline percentage miss this distinction almost every time.
Not Tracking Analytics Across the Full Campaign
Checking performance once at the very end of a campaign misses the chance to catch problems early or double down on what is clearly working. Analytics deliver the most value when they are reviewed consistently throughout a campaign, not just in a single post-mortem report.
How Brand-O-fluence Delivers Verified Influencer Analytics
Brand-O-fluence was built around the idea that every brand should have access to the same quality of data a large enterprise marketing team would expect, without needing a separate analytics stack to get it.
Real-Time Data From the Instagram Graph API
Instead of relying on screenshots or delayed exports, Brand-O-fluence pulls reach, impressions, engagement rate, and story performance directly from the Instagram Graph API. This keeps every number tied to a verifiable source rather than a creator’s own self-reported figures.
Full Audience Breakdown on Every Profile
Every creator profile includes audience age groups, gender distribution, and top cities, giving brands the exact data needed to judge fit before reaching out. This is the same verification approach discussed in our deeper look at how to find the right influencers for your brand, where audience data plays a central role in narrowing down a strong shortlist.
Analytics Built Into Campaign Management
Performance data does not live in a separate tool or a delayed weekly export. It sits inside the same platform where brands manage briefs, approvals, and payments, so decisions about budget and creator performance can happen in real time as a campaign runs.
Consider an Ahmedabad-based home goods brand running a five-creator campaign for a new product line. Two weeks in, verified analytics showed one creator’s story completion rate was less than half the campaign average, despite a healthy overall engagement rate on their feed posts. The brand reallocated a portion of the remaining budget toward the two strongest-performing creators instead of waiting until the campaign ended to notice the gap, and the adjusted campaign closed with a meaningfully higher overall click-through rate than the brand’s previous, unmonitored launch.
Step-by-Step: Setting Up Analytics Tracking for Your Next Campaign
Use this sequence before your next campaign launches, rather than trying to retrofit measurement once content is already live.
- Define your primary metric: Decide upfront whether awareness, engagement, or conversion is the main goal for this campaign.
- Set a measurement baseline: Record starting follower counts, average engagement, and any relevant sales figures before launch.
- Assign tracking links or codes: Give every creator a unique link or promo code so results can be attributed correctly.
- Pull verified audience data: Confirm age, gender, and location breakdowns for each creator before content goes live.
- Check performance mid-campaign: Review reach, engagement, and story completion at the midpoint, not only at the end.
- Reallocate budget if needed: Shift remaining spend toward creators who are clearly outperforming the rest.
- Compile a final report: Summarize verified metrics against your original goal to guide the next campaign’s decisions.
Screenshots vs Verified Platform Analytics
The table below compares the two most common ways brands access influencer performance data.
| Factor | Creator-Sent Screenshots | Verified Platform Analytics |
|---|---|---|
| Source of Data | Self-reported by the creator | Pulled from platform APIs |
| Timing | Whenever the creator chooses to send it | Available continuously during the campaign |
| Comparability | Inconsistent formats across creators | Standardized across every profile |
| Audience Data | Rarely included | Age, gender, and city included by default |
| Trustworthiness | Easy to edit or selectively share | Verified and difficult to manipulate |
Frequently Asked Questions About Why Influencer Analytics Matter
What are the most important influencer analytics to track?
Reach, engagement rate, and audience demographics form the core of most useful influencer analytics, with story performance and conversion metrics added depending on the campaign goal. Awareness campaigns lean more on reach and impressions, while conversion-focused campaigns prioritize click-through rate and direct sales attribution. The right mix depends entirely on what you are trying to achieve, so define your primary goal before you decide which numbers matter most for a given campaign.
Why do screenshots not count as reliable analytics?
Screenshots reflect only what a creator chooses to share, at a moment they control, with no independent way to verify the numbers shown. They also make it difficult to compare performance consistently across multiple creators in the same campaign. Verified, platform-sourced data solves both problems at once.
How often should I check analytics during a campaign?
Check performance at least once at the midpoint of a campaign, in addition to a full review once it wraps up, so you can catch underperforming creators while there is still time to adjust. Waiting until the very end to look at analytics removes any chance to reallocate budget mid-flight. Frequent, lightweight check-ins tend to work better than one large report at the finish line.
Do audience insights matter more than engagement rate?
Audience insights and engagement rate work together rather than competing for importance, since a highly engaged audience that does not match your target customer still will not convert well. A creator needs both a genuinely engaged audience and a strong overlap with your buyer persona to be a good fit. Skipping either check leaves a real gap in your evaluation.
Can small brands access the same quality of analytics as large enterprises?
Yes, verified discovery and analytics platforms have made this level of data accessible to brands of almost any size, not just enterprise marketing teams with dedicated analytics staff. Instead of building custom dashboards or hiring a data team, brands can pull verified reach, engagement, and audience data directly from a platform built for this purpose. This has significantly leveled the playing field for smaller and mid-sized brands.
Understanding why influencer analytics matter comes down to a simple shift: measuring what a campaign actually did instead of guessing based on how impressive it looked. Reach and impressions tell you how far content traveled, engagement rate tells you how strongly people responded, and audience insights tell you whether those people were ever the right customer to begin with. Brands that track these numbers consistently make faster, better decisions, and they build a track record that makes every future campaign easier to plan. Over time, this turns influencer marketing from a series of one-off bets into a channel your team can forecast and improve with real confidence.
If you want creator data you can actually trust, explore Brand-O-fluence today. Review verified reach, engagement, and audience insights on every profile before you commit budget, and track performance in real time once your campaign is live. Whether you are running your first influencer campaign or your fiftieth, the same principle holds: the brands that measure consistently are the ones that keep improving. Start making analytics-backed decisions on Brand-O-fluence instead of waiting until a campaign ends to find out whether it worked.
Leave a Reply